HomePage   
   

Tesseral Troubleshooting

Contents

1.1 Technical Issues

1. Q: Program does not work on initial load.

A: Depending on error message:

a)   If message contains some names with .dll extension it means that some standard dynamic libraries are missing. All necessary DLL are supplied with installation. Repeat installation.

b)   If message is about error in program, there may be damaged .tes model project file relating to last Tesseral2D working session. Delete .tes file from corresponding folder. If problem persists begin session by clicking on the necessary model file name from Windows Explorer.

2. Q: Program works but produces I/O error messages, for example when writing recover point data. Computations make the operation system unstable.

A: Program was installed to the system disk (usually C:) and it is full, the swapping virtual memory and storing temporary data to this disk is hampered. Free space on disk and/or move the data folder to another disk with more available space.

3. Q: Starting of the program takes too much time.

A: The program is loading all files that were in the main window at last session. You can change this option in Options dialog.

4. Q: Calculation takes too much time

A: Probably it is caused by too big peak frequency of a source, or/and model has too small minimal compression velocity value. If the area with low velocity is rather small you can to set this parameter to bigger value in Modeling/Full-Wave dialog, as this value defines the size of a cell of a computational grid (along with peak frequency it determines minimal wavelength, basing on which default computation grid cell size is calculated). Limits of a computational grid for a point source are determined by a position the observation line (receivers), a source and apertures (dialog Framework/Observation) and in this case can be much narrower than the general width of model. If computational grid is too big in relation to the main computer memory (more than <Main Memory Size>-500Mb) calculation can become very slow because of an exchange between virtual memory (on a hard disk) and the main one.

See also: Tesseral Parallel Processing Options

5. Q: Program produces error messages relating to insufficient memory

A: Any program cannot use more than some determined limit (depending on Windows version and 64- or 32 bit variant or operating system) of RAM, actually it is possible to allocate less main memory, instead of the theoretical maximum because allocated memory frequently is fragmented, and it is impossible to allocate a contiguous memory area (for example, when it is already distributed more than 2 GB usually are possible to allocate 3-4 areas by 200Мb, but not always is possible to allocate at once the buffer of the size of 600 Mb). Besides, some main memory volume is always allocated to the system utilities.

All above restrictions are lifted for 64-bit Window operation systems.

To minimize possibility of the program messages relating to insufficient memory, the virtual memory setting in Windows should be high enough. In Windows XP and higher this it may be set via Control Panel > System > Advanced > Performance Settings > Advanced > Virtual Memory > Change. Select "Custom size" and set the initial and maximum sizes to the same value.

6. Q: Computation is unstable – program is producing (in Report window) such kind of message or abnormally big values appear in the wave field
A:Most probably it is caused by the contact with high velocity (more than 300% than in adjacent area) protruding inclusion. Other reason is inconsistent relation between Vp and Vs velocities (Vs<Vp*√2, this relation is also controlled by Poisson Ratio shown in Edit Polygon dialog). You can try to increase computation grid cell size (usually is enough by 20% - 50% from the default value) or introduce thin intermediate layer between this high velocity protrusion and adjacent medium or make it smoother in the problematic area.

7. Q: I have imported data with distance measured in feet (or other data like velocity, density etc.), but program interprets it as measured in meters (m/s, kg/m^3, etc)

A: If there is ambiguity (like at import of data in formats like LAS or SEGY model (where time unit are interpreted as depth)) units are treated as measured in units assigned in the dialog Options/Units, (by default – metric system of units). You have to assign corresponding measurement units before importing such data. Then when data is imported, you can reassign again convenient for you units – imported data will not be changed.

8. Q: No color background in Modelbuilder or Viewer window

A: You must check current palette option. If it is set to Gray or Color< you have to set Default Incremental for Modelbuilder or Default Dipolar palette for Viewer from palette selection dialog. If some grid file still cannot be seen in the Viewer, you can check if there are some data with nonzero values by moving mouse pointer inside this panel and observing corresponding numeric values in the window state bar (lower border). If this file has zeroes only – the problem is with the file itself.

9. Q: At the opening of the model file it is shown in the preview window but cannot be saved with the same name

A: Location where file is stored or the file itself may have Read only attributes. Change file location or disable this file attribute with File/Property operation system dialog: click right mouse button on the file icon in the Windows Explorer window and choose Property.

1.2 Modeling Issues

1. Q: There are waves coming inside off the visible model border.

A: These are artificial reflections from the edges of the calculation grid. In Tesseral technique those reflections are normally reduced to about 1% of initial impulse, but cannot be completely eliminated. In some conditions those reflections may have higher amplitude (e.g., if computation grid cell size or time step has significantly different values the default ones). If reflections are going out of the model sides, it is possible, that you closed some polygons near the model sides and they form vertical contact with the background (number 0) polygon. If not, try to make this border out of reach for significant part of the synthetic records by increasing model area or computation aperture, or change computation parameters to make them closer (if not) to the default ones.

2. Q: The recorded events are distorted with high frequency noise (tails).

A: The computation parameters are set by default to trade between quality of results and speed of computations. In some conditions the grid dispersion may occur. If is used PF-Attenuation mode of computations it also may produce some high frequency and low amplitude dissipated noise, which in this case is inevitable. Otherwise, try to decrease the computation grid cell size (normally, not more than twice from default values, see also next Q&A).

3. Q: When the model surface has topography and Free surface option is set, the high frequency noise appears near the surface.

A: Try to decrease the computation grid cell size to better correspond with shear wave minimal wavelength (cell_size ~ min.wavelength/10), and when at viewing the results use the smoothing option.

4. Q: The recorded events differ from initial wavelet.

A: Such distortion occurs (if it is caused by high frequency noise see previous Q&A) by conditions of initial signal excitation. The wave front initially has different curvature near the point (points) of excitation between inner and outside wave front parts. This is intrinsic feature of the full-wave modeling that closely simulates wave propagation conditions. If source is placed near the free surface (defined as visible in seismic field), this can be an additional cause of distortions, for example, inversion of the signal sign. In latter case, use option of the signal inversion at visualization of the results. You may try to vary with wavelet types.

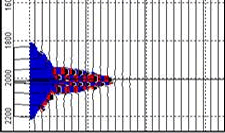
Homogeneous model Vp=1500 m/s, Rikker wavelet 50Hz. Distortions of initial wave form are minimal.

5. Q: Reflected wave looks having inverted phase relatively to incoming (from the source) direct wave.

A: In case when compression velocity (seismic impedance) Vp2 in lower layer is bigger than Vp1 in upper one, phase of reflected wave for Vz-component is inverted. In case if Vp2 < Vp1 (velocity inversion) phase of reflected wave for Vz-component remains the same.

6. Q: Receiver or Source points have option Cable, but are not projected with even intervals.

A:You must align them on without Free option on some line inside model rectangle (on rugged surface they are automatically projected by default with Cable option), and then repeat projection.

7. Q: How to use (Tesseral) modeling for planning of the source parameters (type, frequency/power, well depth, casing etc)?

A: In the used linear approximations (medium is non-absorbing) it is assumed that medium has linear response (for example, twice more charge in the same condition is producing twice more energy of incoming to receivers waves). In reality the more concentrated force is applied (in the area of the source) - the more non-linear attenuating response (of the medium) may be. This non-linear response (partially it can be modeled using visco-elastic approximation) is affecting frequency specter (frequency-amplitude content) of originated (by the source) waves.

8. Q: How to use (Tesseral) modeling for ultrasound scale of modeling?

A: For such kind of modeling it is better to upscale the model x 1000 times to better correspond with conventionally used in seismic scales (you can do it for the already built model by using Stretch/Squeeze option from Framework/Cross-section dialog):

a) Initially built model of airgun; b) after up scaling 1000 times: 1m corresponds to 1mm; 1ms – to 1 mcs; 1Hz – to 1 KHz.

Results of elastic modeling for airgun source.

9. Q: Numerical AVO-modeling: Besides of AVO-curves, is it possible to see the seismic response too, not just the curve?

A: At AVO-modeling you can also see and analyze shotgathers and wavefield snapshots containing the incident and reflected waves recorded on some distance from a target boundary.

10. Q: Can I import a common-shot gather in SEGY format and directly perform AVO studies?

A: Presently the package does not provide functionalities of AVO-analysis per se. It is oriented towards modeling of AVO-effect for complexly build medium - not to substitute special packages of AVO-analysis.

1.3 2.5D-3C Modeling Issues

1. Q: How to fit computation parameters for 2.5D-3C modeling?

A: Please, see Modeling 2.5D-3C Fitting Computation Parameters

2. Q: What are applications of 2.5D-3C modeling and what theory is behind?

A: Please, see Modeling 2.5D-3C

1.4 Theory & Thesaurus

1. Q: What theory is behind modeling algorithms in Tesseral?

A: Please, see following documents:
Wavefield Theory for Multiparameter Medium in Tesseral
Wave Equation Finite-difference Calculations in Tesseral

2. Q: What sample rock properties and correlations between different properties are used in Tesseral?

A: Please, see following documents:
Samples Rock Properties
Correlations Rock Properties

3. Q: Where I can take some general and compact information about rock properties relevant to geophysics and particularly seismic?

A: Please, see following compilations:
Thesaurus Rock Properties General
Thesaurus Seismic Rock Properties

   
   Copyright © 2007 - 2024 , Tesseral Technologies Inc.